
The original article was written by Samuele Ardizio, NVH Sales Engineer at Dewesoft, Italy and Lorenzo Mosenich, CEO, at EASTING.
Summary of Vehicle Ride Comfort Analysis of a Vintage Car
Firstly, a vintage car collector owned a beautiful 1960’s Italian made Lancia Flaminia vehicle. He had recently noticed when the engine was running, he felt unexpected vibrations. Due to his knowledge and experience with NVH (Noise, Vibration and Harshness) – he knew that this wasn’t a normal characteristic of his vehicle. So, he took his car to a Dewesoft Customer called EASTING. Where he knew they could do a vibration comfort analysis test of his vehicle.
Therefore, the aim of the test was to improve the vibrational comfort of the 1960’s vehicle.
About the Lancia Flaminia
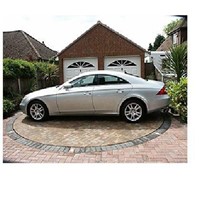
Firstly, Lancia was an Italian Automobile manufacturer established in 1906. It manufactured a range of luxury vehicles. The Flaminia was first introduced in 1957. It was named after the Via Flaminia, which was one the first Roman roads recognised back in 220 B.C.
Facts from Wikipedia about the Lancia Flaminia include:
- Lancia Flaminia models included Tipo 813/823/824/826.
- Manufactured by Lancia from 1957 until 1970
- It was available as a saloon, coupe and cabriolet and four stretch limousine versions were made
- It was the manufacturer’s flagship model at the time
- There were 12,633 Flaminia’s sold over 13 years
- Coupes were the most popular model but cost as much the four door sedan
- The car manufacturer eventually went bankrupt and was bought out by Fiat in 1969
The car owner loves vintage cars and technology. His collection includes his prized Flaminia four door sedan which is used for weddings and other special events.
EASTING – the testing partner
EASTING is based in several locations in Italy. Firstly, they develop and customise measurement solutions. Firstly, their experience in testing guides customers through all the measurement steps. Including choosing, supplying, and setting up the right instrumentation for processing and analysing measured data. Therefore, making them the perfect partner for this troubleshooting exercise.

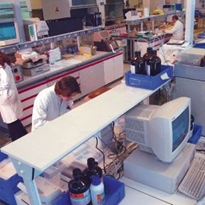
Figure 1. The Electronics division within the Easting group can develop new tools and customise measurement solutions according to customer needs.
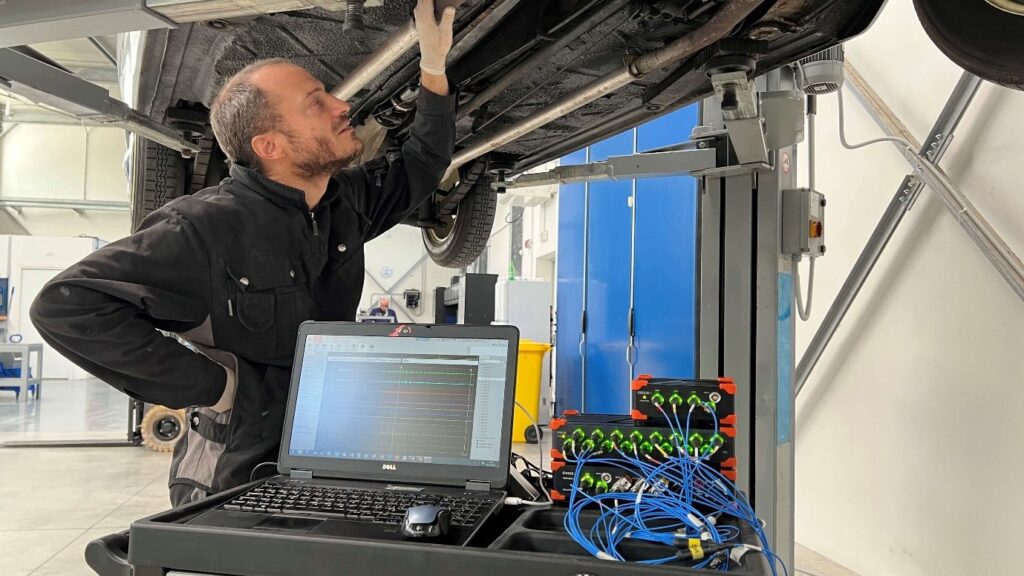
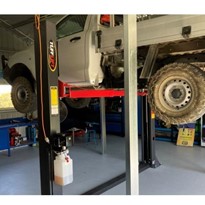
Figure 2. Lorenzo Mosenich is inspecting the measurement setup.
The issue – shaft unbalances
Firstly, the vintage car collector asked Easting to take care of the vibrational issues of his 1960s Lancia Flaminia Berlina. The levels of vibration were disturbing the driving comfort.
The car is a rear-wheel drive sedan with a 2.8 litre and V6 cylinder engine. However, it has a transaxle. This is a combination of a transmission and an axle. The transaxle transmits the power from the engine to the rear wheels. Therefore, it provides the necessary gear ratios for acceleration and deceleration.
Typically, Lancia transaxles are designed to be lightweight and efficient and were applied in various Lancia models. They were known for their reliability and durability. In summary, they were a key component of many of the company’s successful vehicles.
Most commonly in cars, the clutch connects directly to the powertrain. However, in the Flaminia, the clutch is in the gearbox case in the rear of the vehicle. This car’s gearbox is in a single block with the differential and the rear brakes. This refined technical device ensures better weight distribution, grip, and braking.
Nonetheless, this implies that the prop shaft always rotates with the engine crankshaft. Therefore, due to this design, eventual prop shaft unbalances are understandable. It is felt within the car in even the quietest conditions, such as engine idle and low revolutions.
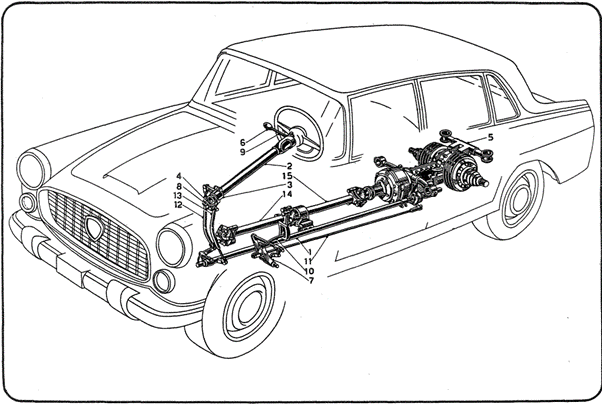
Figure 3. Schematics of the Lancia Flaminia transmission system.
Schematics Key
| Number | Description |
| 1 | Shaft, gear remote control |
| 2 | Shaft, gear control lever |
| 3 | End gear control lever shaft lower |
| 4 | Yoke, gear selection |
| 5 | Gearbox |
| 6 | Knob, gear control lever |
| 7 | Lever, clutch pedal |
| 8 | Lever, gear selector idler |
| 9 | Lever, gear connector |
| 10 | Pedal, clutch |
| 11 | Rod, clutch control |
| 12 | Rod, gear control |
| 13 | Rod, gear selector |
| 14 | Propeller shaft |
| 15 | Propeller Shaft Assy |
Next, the owner asked EASTING to improve the driving comfort index of his car. EASTING set out to reduce the prop shaft unbalance. As well as checking the status of the gear box and the engine rubber mounts.
The Solution
Noise, Vibration and Harshness (known as NVH) System was needed. Did you know that NVH is an engineering discipline. It is a study of the noise and vibration characteristics of vehicles including
- Vehicle riding quality (Comfort)
- Gearbox, driveline, pump characterisation (idle, rattle, whine etc.)
- Powertrain and driveline NVH
- Operational Deflection Shapes
- Rotating Machinery Diagnosis
- Transfer Path Analysis and structural propagation analysis
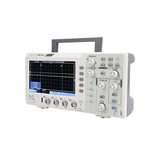
In order to address the unbalance measurement, EASTING used Data Acquisition from the SIRIUS family and DewesoftX Software with the Balancing Module. As well as the ODS functionalities of the Modal Testing Module.
System setup
EASTING was able to choose the ideal vibration testing equipment for the task. They have a large range of the latest Dewesoft DAQ equipment available for all vehicle testing requirements.
- SIRIUS-HD-16xACC – 16 channel differential SIRIUS DAQ slice with voltage and IEPE input modes.
- SIRIUSm-3xACC-1xACC+ – 4 channel differential SIRIUSm DAQ slice with voltage and IEPE input.
- SIRIUS-CUSTOM – 16 channel SIRIUS DAQ slice.
- DewesoftX – data acquisition software for data recording, signal processing, and data visualisation.
- DewesoftX Rotor Balancer – single and dual plane rotor balancing for DewesoftX software.
- DewesoftX Modal Test – modal testing add-on for DewesoftX software.
- 8x PCB Piezotronics triaxial accelerometers
- 1x tacho pick-up for RPM
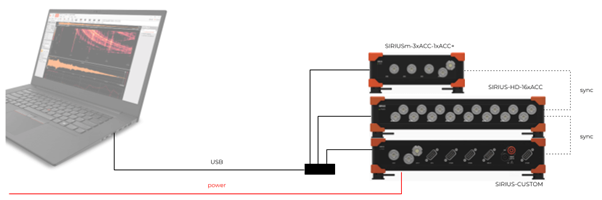
Figure 4. System setup including three fully synchronized SIRIUS slices.
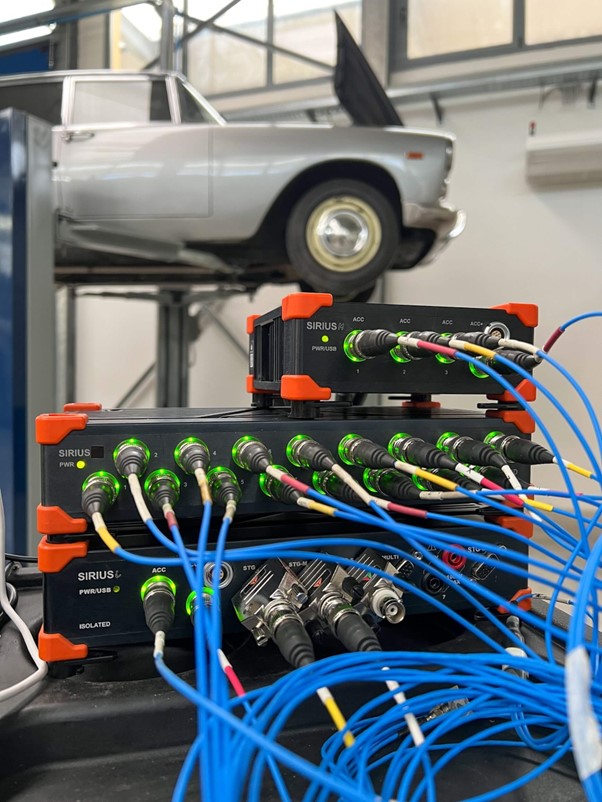
Figure 5. The specific choice of modules used reflects the mix at hand at EASTING.
Vehicle Axle Balancing
Vehicle Axle Balancing means making sure the vehicle’s weight is evenly distributed around the axle.
Dewesoft’s balancing tool for rotation has an easy 3-step process:
- Record the actual status
- Add a trial mass
- Add the calculated correction mass at the appropriate angle in the last step.
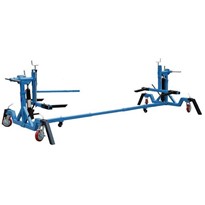
EASTING designed a pair of specific collars for applying the balancing masses. This was without modifying the original layout.
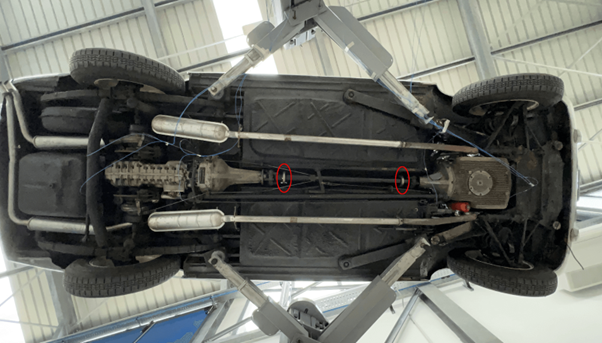
Figure 6. Positioning of the two collars on the car’s transmission.
EASTING used the Dewesoft Balancing software module to reduce vibrations related to the first order.
Basically, it worked like this:
- EASTING measured the initial state and then added a trial weight of the known mass.
- Next, they calculated the position and mass of a counterweight.
- They then removed the trial weight, and added the calculated weight on the opposite side to cancel out the imbalance.
In the end, EASTING managed to reduce vibration on the receiving accelerometers by 70%.
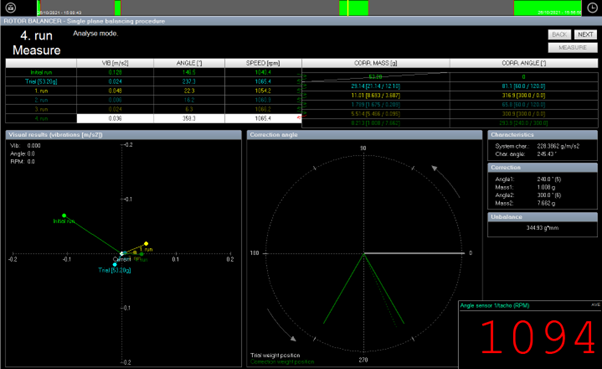
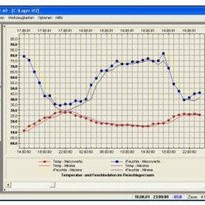
Figure 7. DewesoftX rotor balancing measurement screen.
As part of their business process, EASTING invited the owner for a subjective evaluation. His judgment was that it is better but not perfect.
It was decided that further analysis of the mounts was required. EASTING recognised that the balancing procedure might have been affected by a suspicious natural frequency. Therefore, never balance across resonance!
Furthermore, they analysed an elastic system changing its properties with temperature and load.
To better understand underbody behaviour, they instrumented the car for carrying out the ODS test.
Operating Deflection Shapes (ODS)
Firstly, Operating Deflection Shapes (ODS) is a technique used to identify the root cause of problems in mechanical systems. Problems such as vibration, noise, or fatigue failure. The test visualises the movement of individual components during operation. Consequently, showing how a machine or a structure moves within its operational conditions. ODS testing involves no applied artificial forces. So the operating machinery under test is only excited by itself, and only response vibration signals are measured.
To achieve this a series of sensors, most often accelerometers, are placed at strategic locations on the mechanical system. These sensors measure the movement of the system components as it operates. The data can create a graphical representation of the system’s movement, known as an operating deflection shape.
By analysing the operation deflection shapes of a system, engineers and technicians can identify areas of excessive stress or movement. Steps are taken to correct the issue, and improve the reliability and performance of the system.
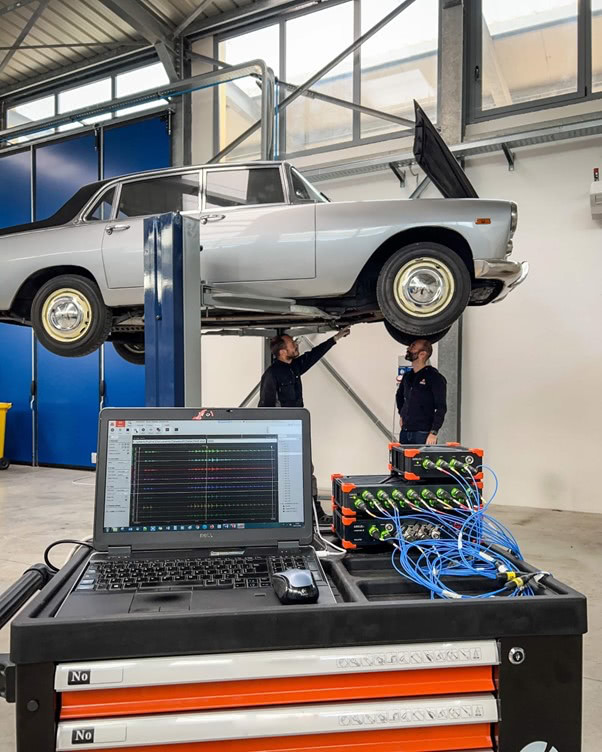
Figure 8. Checking the placement of the sensors.
Frequency operating deflection shapes (FODS)
Frequency Operating Deflection Shapes (FODS) is a variation of operating deflection shapes (ODS). However, it adds a frequency component to the analysis. Like ODS, FODS is a technique used to analyse the dynamic behaviour of mechanical systems during operation. Also achieved by visualising the movement of its components. However, FODS goes a step further. This is accomplished by analysing the movement’s frequency. Which in turn provides additional insight into the system’s behaviour.
Data is analysed to determine the frequency of the component movement. A Graphical representation is generated. This shows the system’s movements at different frequencies, known as a frequency operation deflection shape. Frequency ODS is the simplest method to see how a machine or structure moves during action at a specific frequency.
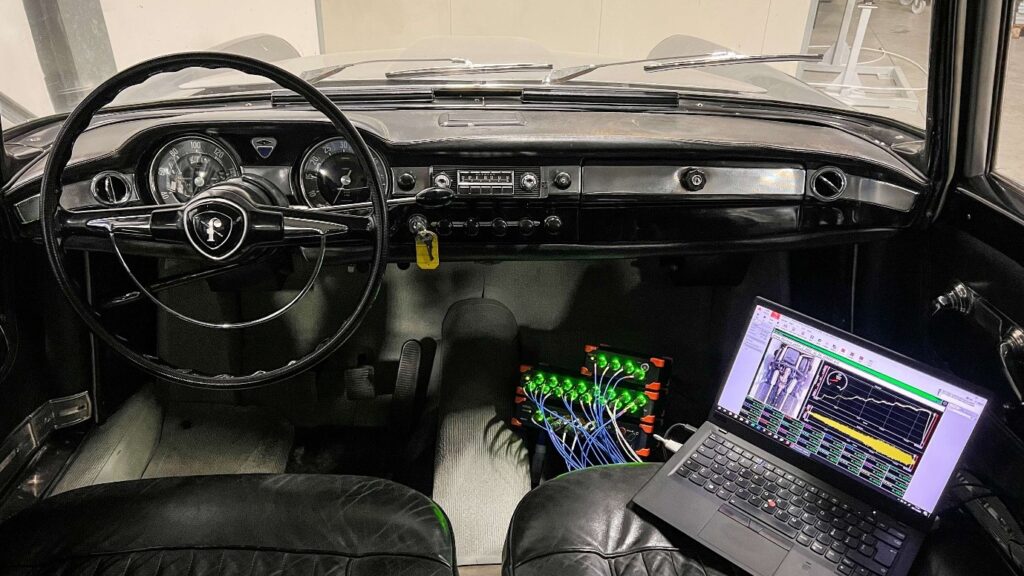
Figure 9. The measurement setup in the car.
So, during the measurement of the Flaminia transmission system, EASTING acquired only the raw signals to speed up the test as much as possible.
The Benefits of FODS
One benefit of using FODS over ODS is that it identifies areas of excessive movement or stress at specific frequencies. This is useful in identifying problems that may not be as apparent with a simple ODS analysis.
For example, a system is experiencing vibration at a specific frequency. An ODS analysis may not reveal the source of the problem. Whereas in a FOD Analysis it can identify the components that are moving excessively at that frequency. Therefore, helping to pinpoint the root cause of the issue.
Another benefit of FODS is that it can provide a more detailed understanding of the dynamic behaviour of a system. By analysing the movement of the system’s components at different frequencies, it is possible to identify patterns or trends in the data that may not be apparent with a simple ODS analysis. FODS can identify potential problems. Or it can be used to develop strategies to improve the system’s performance.
The DewesoftX Modal suite supports ODS and FODS testing. With Frequency ODS, one of the acceleration sensors is defined as the excitation reference signal. Whilst the others are response sensors. As usual in the software, animations can be displayed but only work optimally in areas with good coherence.
The only math channel enabled online was the one that calculates the RPM value from the voltage pulse train of the tacho pick-up.
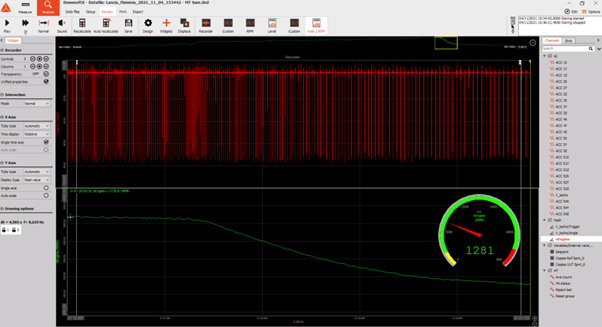
Figure 10. Result of the Angle Sensor Math.
Analysis
The analysis consisted of the Operational Deflection Shape of measured points and the evaluation of vibration magnitude at critical RPM/orders.
Order analysis separates rotational or reciprocating vibration into orders. The first order is the reference value corresponding with the machine’s rotational speed (RPM). In other words, the first order and the frequency of the rotation are the same value. The subsequent orders (2, 3, 4, etc.) are a multiple of that value.
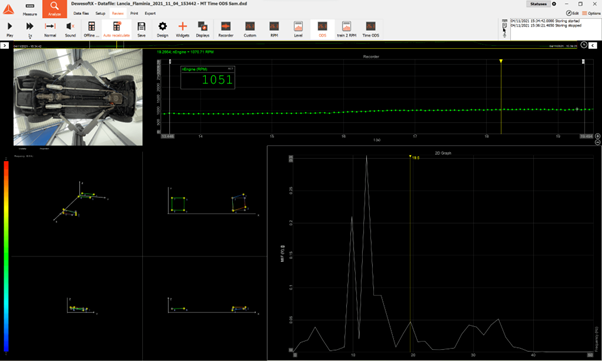
Figure 11. DewesoftX Modal test plug-in software interface.
Conclusion
Initially, the ODS analysis showed a first-order reduction at the synchronous frequency. However, a “well-animated” gearbox deflection mode was still at 12 Hz. EASTING had solved the shaft balancing problem, but the overall behaviour still had to be improved.
EASTING’s next step will be to replace the old and worn-out mounts. Then repeat the test to check the gearbox behaviour and eventually recheck the prop shaft balancing.
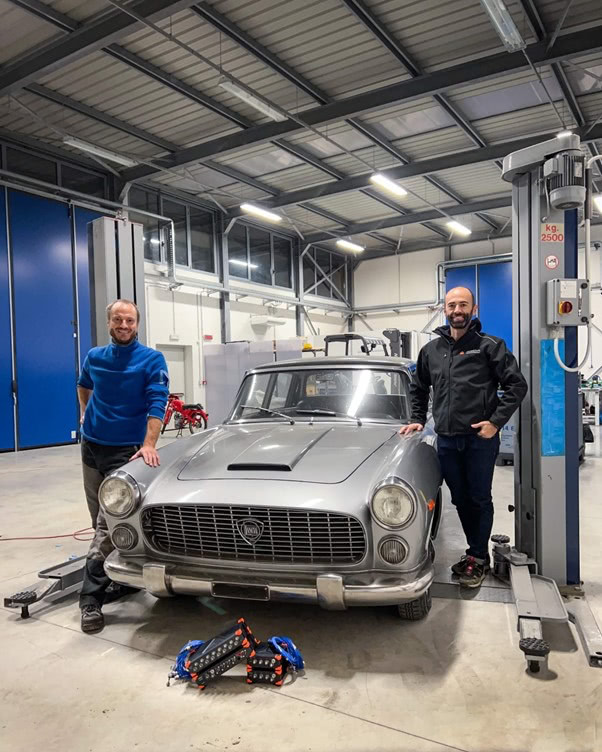
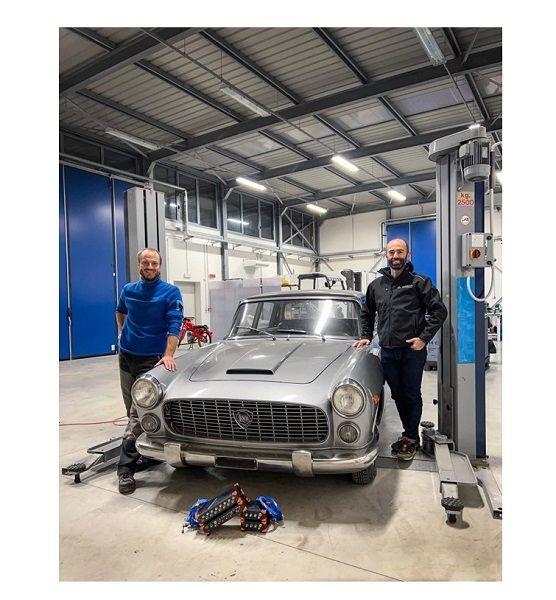
Figure 12. Lorenzo Mosenich on the left, Samuele Ardizio on the right.


-160x160-state_article-rel-cat.png)
-160x160-state_article-rel-cat.png)


-205x205.jpg)
(1)-205x205.jpg)