In addition to managing and maintaining the local distribution assets in Albstadt, Albstadtwerke operate and maintain two more potable water distribution networks, seven natural gas distribution networks and an electricity supply.
Albstadtwerke is efficiently run with 80 employees for the entire operation and construction of our networks and facilities. It has been a corporate policy for many years to continuously evaluate current methodologies and introduce new innovative methods in leak detection and trenchless pipe installation.
In this paper we will share information about our vast experience with innovative technologies in reducing water loss and information about our latest system that permanently monitors the network and alerts us as soon as a leak appears.
An Overview of our Network
Albstadtwerke is more than a network operator, we are an energy service provider for the region and have developed a sizeable business with 37,000 customers, 46,000 residents and sales of €70,000,000 ($AU92,252,954).
We have to be innovative in network operation and provide an entire portfolio of energy to survive
in this deregulated energy market.
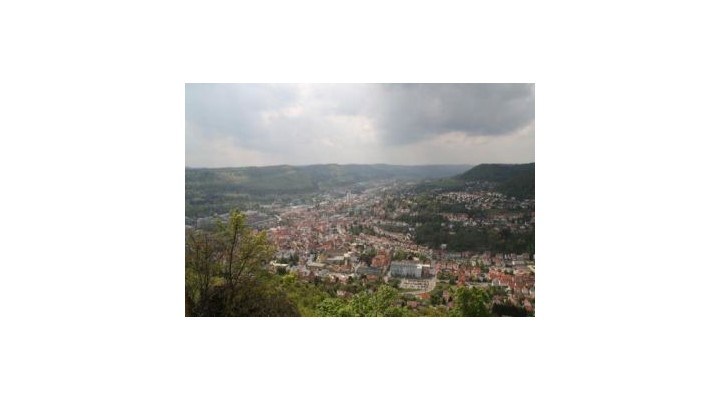
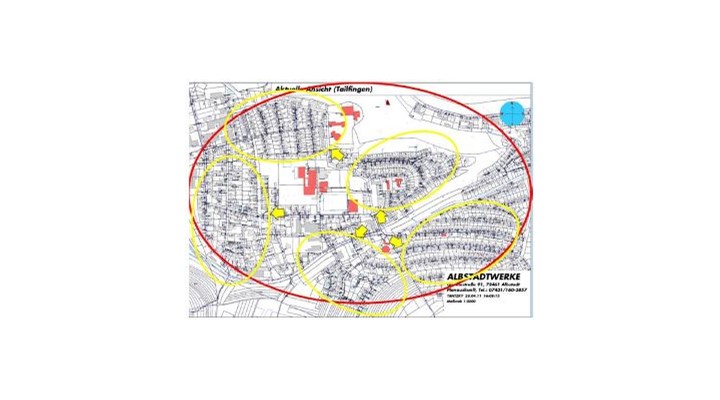
Figure 1, shows a picture of the Albstadt region which is spread across three valleys and has a height variation of 400 meters. This geographical landscape creates a number of operational challenges including:
- A large number of different pressure zones
- Long sections of trunk main
- Long distances for maintenance staff to drive to reach the extremities of the network
Approximately 50 per cent of the water we supply comes from our raw water catchment and is processed in several stages at our water plant to produce high quality drinking water.
The other 50 per cent is purchased from a total of 3 suppliers. We are about 80km away from the Lake of Constance, which is one of the biggest lakes in Europe.
Our current Non-Revenue Water is 20 per cent (500,000 cubic meters) which has increased from 10 per cent five years ago. The increase in the NRW percentage is due to a 50 per cent reduction in total consumption, our water loss has remained constant.
The ground is lime stone which means that almost no leak is visible on the surface as they always find good drainage in this ground. We have had massive leaks of 25L/S disappear underground.
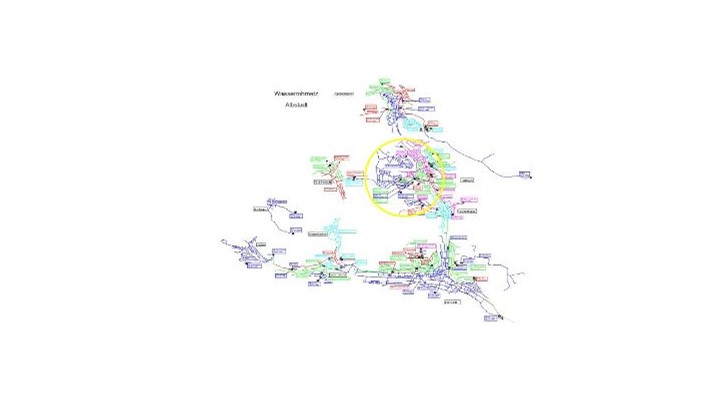
In figure 3 we show the Braunhartsberg reservoir zone. This zone consists of 52km of pipework with a mixture of cast Iron, UPVC and ductile iron and as it is over 30 minutes drive from our office to this zone a great deal of time can be wasted driving back and forth. The zone consists of residential dwellings, small industrial enterprises, a highway and some busy roads. So it contains most of the factors that make leak detection difficult.
Water loss Innovations
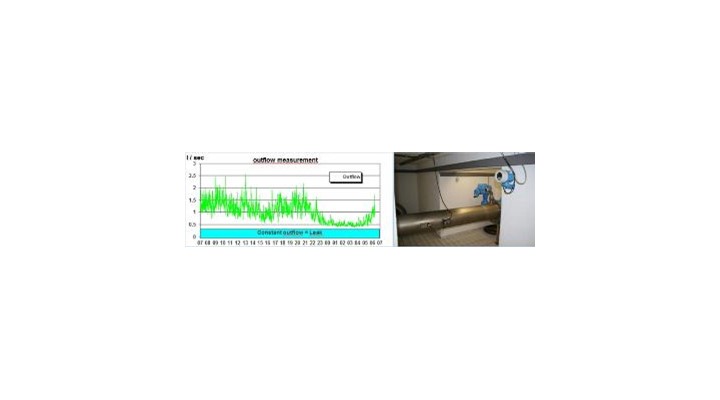
Our first strategy to improve network efficiency was to install a flow meter on the reservoir outflow and have the data sent to our office on a daily basis with alarms to advise us if there was an increase in minimum night flow (MNF). This is shown in Figure 4.
In addition to providing an alarm warning us the MNF was rising, we could also quantify the size of the leak.
Leaks in networks are common: When you begin to look at the right end of the network, you will find the leak at the left end. Start at the left end, you will find the leak in the right.
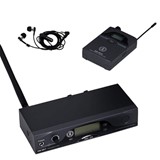
The leak detector must usually search the complete pressure zone to ensure that they have found all the leaks. Leak detection was performed by sending a team out in a van to deploy noise loggers with radio communication and then download the data in a drive-by survey the following day to localise the leak position and use a ground microphone and correlator to pinpoint the leak. This is equipment we have been using for many years and we found only loggers with radio communication could be used efficiently. The loggers are mounted directly on the pipeline with a magnetic connection, to provide a good sound recording. It would often take this two man crew 5 to 10 days to find the leak in this large zone, driving an hour each way every day.
The next strategy made to improve efficiency was to install additional flow meters within the zone to localise the leak position to a smaller area within the zone and reduce the amount of time spent searching for the leak. Figure 6 shows location of the additional six flow meters installed.
It is important to note that we have not divided this large pressure zone into smaller sub-zones, we have just installed additional flow meters. Careful consideration to the hydraulic model was made to identify the best places to install these additional metering points.
We were not measuring or analysing total flow into sub-zones, we are just looking at significant changes in daily water flows to localise the leak positions.
We have tried a number of different flow measurement devices but it has always been imperative that the data could be transmitted to our office.
Our next improvement - the optimal solution?
With the previously identified systems, we were able to achieve good results. However, there was always still a certain amount of effort to carry the measured data to the office for any detailed analysis and then send a crew to pinpoint the leak before the leak is repaired.
Because of our geographical situation, a lot of time was wasted driving back to the office to analyse the data and then back to the field to pin-point the leak.
Therefore, we decided to introduce a system that transmits the data every day to the decision makers in the office to reduce the response time and time lost travelling.
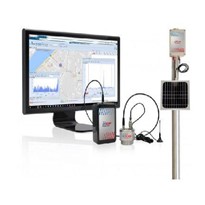
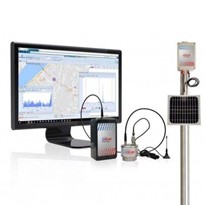
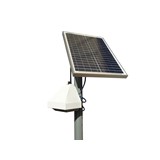
Noise loggers have been deployed through the network, as previously they record the noise levels and sound. If pre-determined limits are exceeded, the logger sends a leak alarm to headquarters. Each logger is connected by radio with a repeater. All repeaters are in contact with a data collector (ALPHA) using radio to collect the data from the repeaters and GPRS to send the data to the server.
We then have immediate access to the measurement data and can make a leak assessment.
By modeling the system with geographic network data, the loggers are able to recognise their position in the network and create the relationship to its "neighboring" loggers. This fact allows a
direct correlation between the loggers and thus a quite precise determination of the leak.
The installation is fast and economical without any structural changes to the distribution system.
Eighty loggers, forty two repeaters and 2 Zonescan ALPHA were deployed in the Braunhartsberg pressure zone enabling fully automated leak monitoring of the entire zone, consisting of 52 km of pipe.
Based on experience with loggers previously deployed, we identified areas for assessment.
Communication Reliabiliity : Since the measuring points is always "on the street", in the past there was often a problem with wireless communication. Especially with transmissions in the GSM network, we found the communication to be very good without the need to install an antenna close to the surface.
Behavior with different weather conditions: We still have real winter. Therefore, it is possible that the road surface sometimes is covered for long periods with a thick layer of snow or coated with thick ice. We expected this to impact the reliability of communication, however there were no problems last winter.
The Lifetime of batteries: We operate in a temperature range from -30 ° C in winter to +30°C in the summer; sometimes. After 12 months of operating the Zonescan, we have had no problems with any of the above points!
The Monitoring Platform
The data is hosted on the Gutermann webserver and accessible via a log in to the ZONESCAN net software. There is mapping, amplitude distribution graphs, frequency spectrum and correlation data in this software platform.
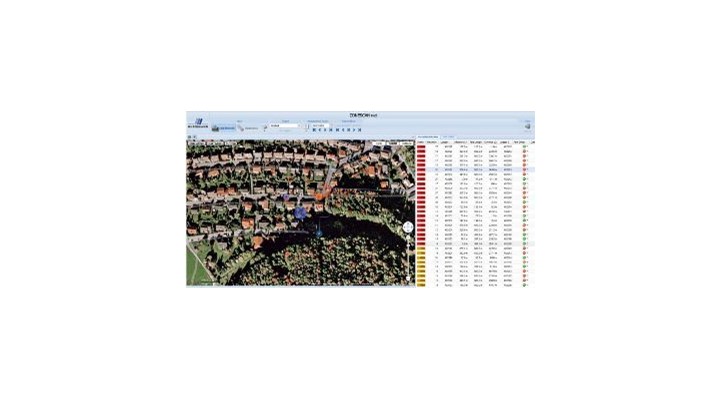
In figure 8 you can see a list of automatic correlations ranked in order of correlation quality. The highlighted correlation in the table is also highlighted in blue on the map. As you can see it is also possible to show the loggers in a satellite picture, this provides better orientation. When this particular leak appeared it was identified with correlations from over 15 logger combinations and we repaired the leak in record time, it started on the 9th February and was repaired on the 10th.
We can select each of the correlations and view the graph to assess the data, using the correlation spectrum we can identify mechanical noises which reduces the amount of time wasted searching for noises that are not leaks.
All of this analysis is performed in the office before any employee goes out to the site!
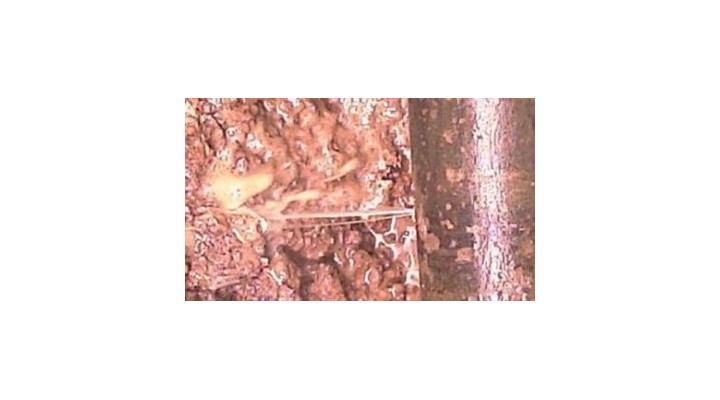
This leak can be seen in Figure 10, the correlation provided by the Zonescan system was less than half a meter from the actual position!
Conclusions
With this technology we have been able to continue to maintain our MNF to 0.4L/S with an average run-time of a leak event being 1.5 days enabling us to reduce our water losses to lower levels than ever before. In addition to this we have reduced the effort and cost of localisation by 98 per cent.
With very good maps of the pipeline network the Zonescan produces a precise location of the leak.
Considering the excavation cost is €3,000 ($AU3,953.69), we still confirm the leak position with a ground microphone before digging.
We had no communication problems during a particularly cold winter, with a thick layer of snow on the ground.
We found small leaks that our experienced leakage team would not have discovered and my leak hunters tell me they can hear the worms cough!